
![]() COCHLEAR
IMPLANT
SIMULATION
version 2.0
COCHLEAR
IMPLANT
SIMULATION
version 2.0

| Main page |
|
The program “Cochlear Implant Simulation” has been developed starting from a model which represents the main stages of the processes involved in sound perception by a cochlear implant patient. This model consideres both, technical and physiological aspects that will condition the sound perception. The simulation program is divided into to main blocks: one for analysis and one for synthesis.
The analysis block represents the processes affecting the audio signal from acquisition from microphone to its transformation into electrical impulses generated at the different electrodes of the implant, and the generation of the action potentials by the auditory nerve.
A first part of this block just consideres the signal processing performed by the cochlear implant system, and through this part, the loss of information associated to the configuration of the cochlear implant and the coding strategy can be represented. A second part of the analysis block represents the interaction between the electrode array and the neural ends, and describes how the pattern of activity in the electrodes is transformed into a pattern of activity in the auditory nerve.
The synthesis block provides an audio signal from the pattern of activity in the auditory nerve obtained from the analysis block. The audio signal is synthesized from the pattern of activity corresponding to each frequency band (associated to each region of the cochlea). This way, the information that was lost due to the analysis process will cause a degradation in the quality of the synthesized signal. Figure 1 represents the block diagram considered for the simulation.
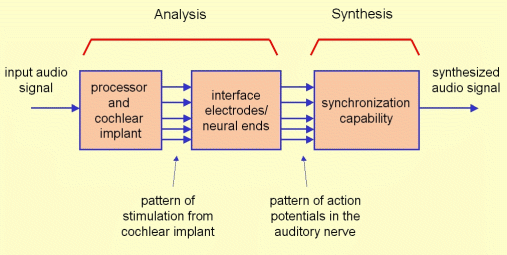
Figure 1: Block diagram of the program “Cochlear Implant Simulation”.
This model allows to consider the main aspects conditioning the perception through a cochlear implant, as the coding strategy, the design of the filter bank, the stimulation rate, the number of channels, the size of the cochlear implant, the allocation of the electrode array, the interaction between the implant electrodes and the neural ends, etc. The signals synthesized according to this models represent the information loss associated to the stimulation through the cochlear implant and this way this allows normal-hearing subjects to hear the sound like it would be perceived by a cochlear implant patient.
Figure 2 shows the block diagram of a conventional cochlear implant system. Audio signal is acquired by the processor microphone and then amplified. Then it is passed to a filter bank in order to separate it into different frequency bands. The output of each filter is then passed through an envelope detector. This way, for each channel, an estimation of the energy for each band is obtained as well as its evolution in time. The dynamic range adaptation block aims to transform the acoustic dynamic range for each channel into the electrical dynamic range necessary for each electrode. This transformation is specific for each patient and different for each electrode. Finally, according to the stimulation rate, the processor generates the stimulation pulses representing the current level to be presented at each electrode and at each time instant. In the case of pulsatile strategies (like CIS or n-of-m strategies) the stimulation pulses are generated in a way such that at each moment there is only one channel active, in order to avoid the problem known as “field summation”. The stimulation pattern computed by the processor is transmitted to cochlear implant and the current pulses are then generated through the electrodes of the implant.
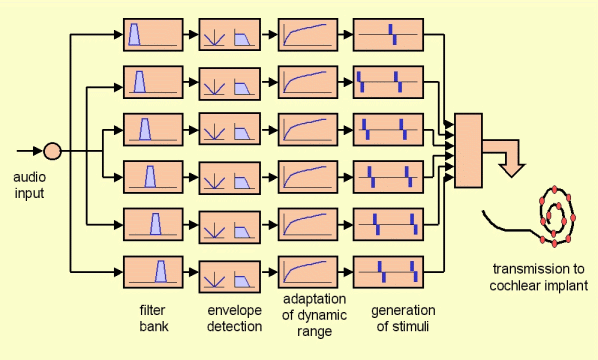
Figure 2: Block diagram of a cochlear implant system.
The program “Cochlear Implant Simulation” processes the sound by emulating the audio signal processing performed by the cochlear implant processor, according to the set of parameters established for simulation. This provides the activity pattern at the electrodes of the cochlear implant that would be obtained when the audio signal is acquired by the microphone.
From this pattern of activity at the electrodes, and according to the model for interaction between electrodes and neural-ends, the pattern of neural activity for the groups of neural ends associated to each cochlear portion is determined. Finally, from this pattern of neural activity, the audio signal is synthesized taking into account the synchronization capability of the neural activity and the characteristic frequencies of the stimulated cochlear portions.
The stimulation rate represents the number of pulses per second generated at each electrode of the cochlear implant. This parameter limits the temporal resolution of the implant, that is, the capability for the perception of fast changes in the properties of the audio signal. As the stimulation rate is lower, the quality of the sound perceived is worse.
The temporal resolution for a cochlear implant patient is limited, in addition to the stimulation rate, by the refractory period of the neurons in the auditory nerve. The time required for the repolarization of the neurons after a neural firing is about 2 ms. For this reason, a stimulation rate above 1000 pulses per second is convenient.
In the program “Cochlear Implant Simulation”, the effect of the stimulation rate has been represented by resampling the envelopes with a sampling frequency equal to the stimulation rate. It should be considered that there are coding strategies using an updating rate lower than the stimulation rate. In that case, the value assigned to the parameter “rate” should be the updating rate and not the stimulation rate, because the updating rate represents the loss of temporal resolution.
One should consider that for extremely low stimulation rates (below 800 or 700 pps) in addition to the loss of temporal resolution there also will be an effect of synchronization of the neural activity with the stimulation pulses, which will degrade additionally the quality of perception through the cochlear implant. This effect has not been modeled in the program “Cochlear Implant Simulation”, and therefore, in the case of extremely low stimulation rates, the quality of the perception would be even worse than in the simulation.
The filter bank used for analysis is composed of equally-spaced filters in the logarithmic scale of frequencies in the range defined by fMin and fMax. The bandwidths of the filters are the same for all filters in this logarithmic scale of frequency, and therefore those with lower central frequencies are narrower than those with higher central frequencies.
Each channel of the cochlear implant has assigned a band-pass filter. The number of channels is specified by the parameter “n-inserted-ci”. As the number of channels is higher, the tonotopic spectral resolution is better. In the case of selecting the option “Hilbert+FIR”, the filters are designed as finite impulsive response (FIR) filters, with 100 coefficients. In the case of selecting the option “Rect-LP+IIR” 6th order Butterworth infinite impulsive response (IIR) filters are used. FIR filters present the inconvenient that their application involve more computation. On the other hand, IIR filters present the disadvantage of causing phase distortion and they could became unstable particularly in the case of narrow bandwidths.
Envelope detection has been implemented either with a rectifier followed by a low-pass filter (for the option “Rect-LP+IIR”) or with the Hilbert transform (option “Hilbert+FIR”). This latter option provides an envelope which represents in an optimal way the temporal evolution of the energy in the frequency band of the filter, but has the disadvantage of requiring a couple of FIR filters in phase quadrature, with the corresponding increment in the computational load.
The parameter “n-of-m” allows the selection of strategies CIS (when n is equal to m, that is, equal to the number of inserted electrodes) or n-of-m strategies (when n is lower than m).
The fundamental of n-of-m strategies consists on the activation, at each stimulation cycle, of only n channels (the n channels with more energy at this cycle) of the m available channels. The objective of n-of-m strategies is to provide an increment in the stimulation rate. This is possible because the reduction of the number of channels activated at each cycle makes the duration of the whole cycle to be shorter. The increment of the stimulation rate using n-of-m has as consequence a reduction of the quality because the information corresponding to those channels with lower energy is lost.
In order to simulate the effect of n-of-m strategies, at each stimulation cycle the envelopes corresponding to the different channels are compared. The n channels with the highest energy are selected and the rest of the channels are set to a null value. This way, the information corresponding to the non selected channels is removed from the synthesized signal.
The interaction among channels has been modeled at the interface electrodes - neural ends. In a previous study the distribution of the current density field for a electrical system similar to a cochlea stimulated by a cochlear implant has been estimated. It has been found that the current inserted from an electrode is spread in a relatively wide region, for both, monopolar an bipolar stimulation modes.
When stimulation is presented at a given electrode, the ideal situation would be that only the neural ends close to this electrode were activated. However, the pulses presented at an electrode activate the neural ends close to this electrode as well as other neural ends situated at more distance. Analogously, a group of neural ends will be activated mainly by the closest electrode, but they will also be activated by other electrodes. This phenomenon could be modeled through a mixture matrix between the channels in the cochlear implant and the “channels in the auditory nerve” (being defined each of these channels as the set of neurons close to a given electrode). This way, all the channels in the cochlear implant contributes to each “channel in the auditory nerve”, and the contribution from each electrode will depend on the distance from each electrode to the considered cochlear portion. In this model we have assumed that the contribution will decay exponentially with the distance, and an interaction coefficient has been defined as the constant of this exponential decay. Some previous studies about the distribution of the current field in the cochlea suggest that an appropriate value for this constant could be around 2 or 3 mm.
In order to establish the mixture matrix describing the interaction among channels, the distance between adjacent electrodes must be considered. In order to do it, the size of the electrode array and the number of electrodes are taken into account. As the distance between electrodes is shorter (or as the interaction coefficient is higher) interaction among channels is stronger, an this cause a loss of tonotopic spectral resolution. In this case, the spectral resolution provided by the cochlear implant is not limited by the number of channels, but by the interaction among channels. As one could expect, for low values of the interaction coefficient, the quality of the synthesized signal is improved as the number of electrodes considered in the simulation is increased. However, for higher values of the interaction coefficient, the spectral resolution does not improve when the distance between adjacent electrodes is smaller than the interaction coefficient.
The block for synthesizing the signal correspond to the block diagram shown in figure 3. The starting point for the synthesis is the pattern of activity after including the interaction among channels. The envelope for each channel represents the energy for each time instant and for each frequency band. Therefore, in order to synthesize the audio signal, an excitation signal is taken (with an uniform distribution of energy in both, time and frequency). This excitation is filtered with a filter bank, and the output of each filter is multiplied by the corresponding envelope. The output of each channel after these operations is a signal limited in frequency (for the frequency band defining each channel) whose energy evolves in time according to the considered envelope. Finally, all the contributions (coming from the different channels) are added, and this provides an audio signal including the contributions for all the processed spectral range.
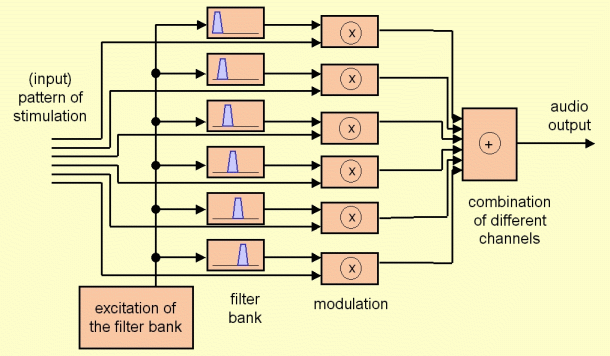
Figure 3: Block diagram of the synthesis part of the program “Cochlear Implant Simulation”.
The excitation signal to be considered can be Gaussian white noise, since this excitation presents flat spectrum and uniform distribution of energy in time. However, signals synthesized using white noise present very poor quality, because the phase of the synthesized signal is random (since the excitation used for each channel has also random phase). The result is an audio signal in which the temporal structure is lost, and particularly the fundamental tone is lost, as it cannot be perceived in the time domain. Several experiments show that most of the patients perceive the sound with better quality than that obtained by synthesizing this way. For this reason, we have proposed an alternative procedure for synthesis. This consists on using a set of impulses as excitation signal. These pulses are located at the time instants for which the envelope reaches a local maximum. An isolated impulse or a set of impulses present a flat spectrum. In order to avoid that the energy of the synthesized signal is conditioned by the excitation (it should depend on the envelopes but not on the excitation of the synthesis block) the excitation signal is normalized in order to make its energy uniform in time. Under this synthesis method, the excitation presented at each band is independent to the rest of bands and it is computed from the local maxima of the envelope of the corresponding band.
The use of an excitation like Gaussian white noise would represent how the sound is perceived by an implanted patient who, due to the damage of the auditory nerve, cannot obtain a good temporal resolution. This situation causes a loss of synchronization of the neural activity with the acoustic stimulus and the fundamental tone is not represented in the pattern of neural activity. This way of perception is present in those patients with hearing losses with more duration, or when the index of surviving neurons is lower, that is, for more extensive cochlear damage.
The use of an excitation like train of impulses would represent the perception of sound by an implanted patient who has a good capability for synchronization of the neural activity. In that case, the pattern of activity of the auditory nerve can follow the evolution of the envelope, and most of the firings takes place in the instants of time when the envelope reaches a peak of energy. This way, the fundamental tone can be perceived from the temporal pattern of activity in the auditory nerve.
In a real case, it could be expected that a patient had a perception with an intermediate quality between both situations, closer to the situation of ``poor synchronization'' when the cochlear damage is more important or closer to the situation of ``good synchronization'' when the state of auditory nerve is better preserved. In order to model this effect, the software ``Cochlear Implant Simulation'' calculates both excitation signals (Gaussian white noise and train of pulses) and combines them according to the ``Synchronization'' parameter.
The filter bank used for synthesis is composed of FIR band-pass filters. FIR filters are used in order to avoid unnecessary additional phase distortion in the process of synthesis. If the option “Frequency Shift” is not activated, the central frequencies and the cutoff frequencies of the filters are the same as those in the filter bank used in the analysis block. When this option is activated, the frequencies and bandwidths of the synthesis filters are determined taking into account the allocation of each electrode and the characteristic frequency corresponding to this allocation according to the place theory. In order to do this, the size of the electrode array, the number of electrodes and the insertion depth are considered.
the spectrum is divided into the low part (corresponding to acoustic stimulation) and the high part (corresponding to electric stimulation). Both parts are separated taking into account the parameter “cutoff frequency”. The part corresponding to acoustic stimulation is obtained by filtering the original signal, using a low-pass filter designed for this cutoff frequency. The part corresponding to electric stimulation is obtained by processing the signal according to the configuration of the cochlear implant, where the spectral range defined for the cochlear implant is extended from the cutoff frequency to the frequency fMax. The synthesized signal is obtained by adding the part corresponding to acoustic stimulation and the part corresponding to electric stimulation.
In order to validate the simulation procedure implemented in the software “Cochlear Implant Simulation”, some tests have been applied by presenting sentences to several patients wearing cochlear implant. These tests consisted on presenting several sentences (including synthesized and original sentences) to each patient. The patients were asked to evaluate the quality they perceived for the synthesized and original sentences.
The initial hypothesis for the validation was that both, the simulation procedure and the cochlear implant system cause a loss of quality. For the test, the implanted patient perceives the sentences after the processing performed by the simulation software and also after the processing performed by his/her own cochlear implant system (in the case of synthesized sentences) or only by the cochlear implant system (in the case of presenting the original sentence).
When the simulation is performed using a configuration providing better quality than that corresponding to the parameters of the cochlear implant system, the quality of the synthesized sentence is not affected by the simulation parameters. In this case, according to the initial hypothesis, the patient should perceive the synthesized sentence with the same quality as the original sentence. When the simulation is performed with a configuration providing worse quality than the parameters of the cochlear implant system, the quality of the synthesized signal is conditioned by the simulation parameters. In this case, the patient should perceive the synthesized sentence with worse quality than the original one.
This way, if all the simulation parameters are set to those in the cochlear implant system for a given patient, except one of the parameters, which is modified from a “good” value (providing better quality) to a “bad” value (providing worse quality) and the quality is represented in a plot versus this parameter, a curve will be observed, where for good values of the parameter the quality tends to be good (similar to that for the original sentence) and for bad values there is a fast degradation of the quality (the synthesized signal is clearly perceived worse than the original). This curve should present a knee for the value when the simulation parameter coincides with the value of the parameter in the cochlear implant system. If this is verified, we can conclude that the simulation models appropriately the effect of this parameter over the hearing quality in a cochlear implant patient.
Validation tests have been passed to 7 patients wearing a cochlear implant. All of them were implanted at the ENT service of Hospital La Paz, Madrid, with a MED-EL Combi40+ device. The validation tests were focused on 3 simulation parameters: the stimulation rate, the number of channels and the inter-channel interaction coefficient. For each parameter, several sentences were synthesized with different values for the parameter to be studied and both, original and synthesized sentences were presented to the patient, who were asked to evaluate the quality of perception of each sentence in a scale from 0 (worst quality) to 10 (best quality).
For the analysis of results, the score for the quality of each synthesized sentence has been normalized by dividing it by the score assigned to the corresponding original sentence. This way, if a synthesized sentence presents a normalized score of 1, it must be interpreted that the patient perceives the synthesized sentence with the same quality as the original one. For each studied parameter, the normalized score has been represented versus the considered parameter. A polynomial fitting (with order 3 and with a minimum squares criterion) has been performed to these data in order to obtain a function fitting the data as well as the corresponding 95% confidence interval.
Figure 4 shows the quality normalized scores versus the stimulation rate considered for simulation. Each point in the plot represents the evaluation of a synthesized sentence by a patient. A fitting of these data is also shown (minimum squares polynomial fitting) as well as the corresponding 95% confidence interval. It can be observed that for high stimulation rates, patients do not perceive a degradation in the quality of the synthesized sentence, and when the stimulation rate is reduced the quality is smaller, and very low quality is observed for rates below 700 pps. There is a knee effect in the plot corresponding to each patient, being the rate of the knee different for each patient (according to the stimulation rate programmed in his/her processor). This result validates the simulation procedure with respect to the stimulation rate.
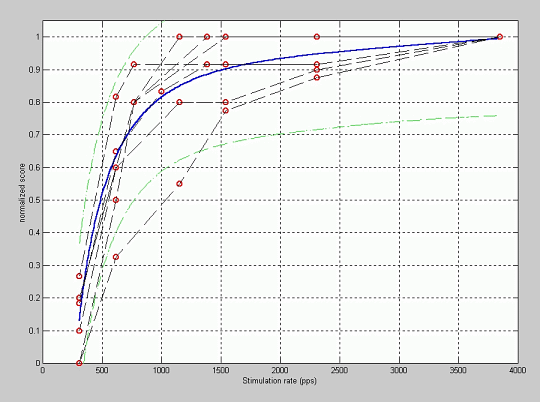
Figure 4: Fitting of the normalized quality score versus the stimulation rate.
In order to verify the influence of the stimulation rate in the simulation related to that programmed in the patient processor, a new fitting of the data has been performed using the normalized stimulation rate as independent variable, i.e., the stimulation rate used for simulation divided by the stimulation rate programmed in the processor. The results of this fitting are shown in figure 5. In this case the knee effect is observed for a normalized stimulation rate close to one, i.e., when the stimulation rate for simulation approximates the stimulation rate programmed in the processor for each patient.
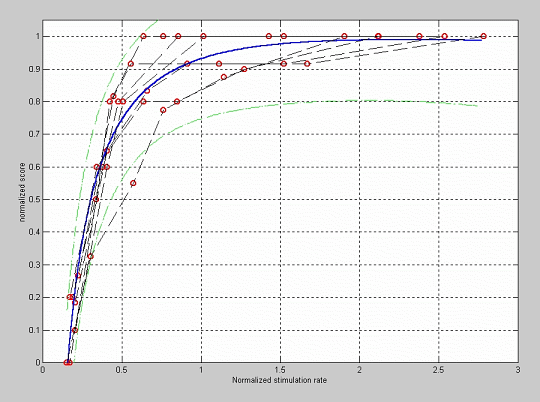
Figure 5: Fitting of the quality normalized score versus the normalized stimulation rate.
Figure 6 shows the fitting between the normalized quality score and the number of channels used for simulation. The patients had programming maps in the processor with a number of activated electrodes between 9 and 12 (2 patients with 9 electrodes, 1 with 10, 1 with 11 and 3 with 12).
In these plots, the knee effect is also observed, being the quality of the synthesized sentence similar to that of the original sentence for a high number of channels in the simulation and a fast degradation is produced in the quality when the number of channels in the simulation is smaller than 8. It is interesting to remark the fact that the knee is not around the number of channels for each patient, but always around 8 channels. This shows that the tonotopic spectral resolution obtained by the patients is not conditioned by the number of electrodes but by some other phenomenon. The tonotopic spectral resolution in the perception of sound is equivalent to having around 8 channels, in spite of having more channels. The reason of this limitation in the tonotopic spectral resolution is probably the interaction among channels.
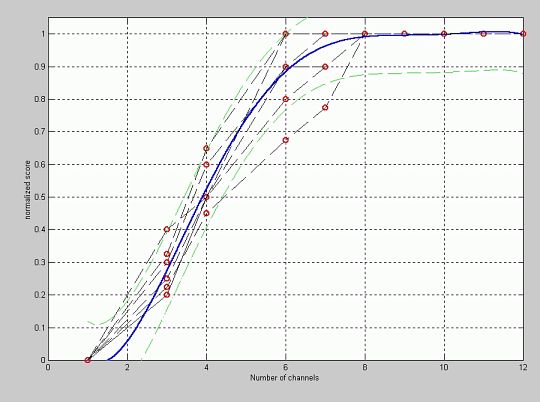
Figure 6: Fitting of the normalized quality score versus the number of channels.
In order to evaluate the effect of the interaction among channels we have prepared tests in which the channel interaction coefficient has been modified for the simulation. The results are shown in figure 7. It can be observed that when the signal is synthesized with a small interaction coefficient, the quality of the synthesized sentence is perceived similar to that of the original sentence, but as this coefficient is increased, the quality of the signal is significantly degraded. The knee in these plots is observed for a coefficient around 1 or 2 mm, which suggests that the interaction between electrodes and neural ends can be modeled by means of the channel interaction coefficient by assigning a value close to 1 or 2 mm to this coefficient. This value is consistent with some previous observations and theoretical studies about the distribution of the density of current in the electrical system corresponding to the cochlea and the cochlear implant.
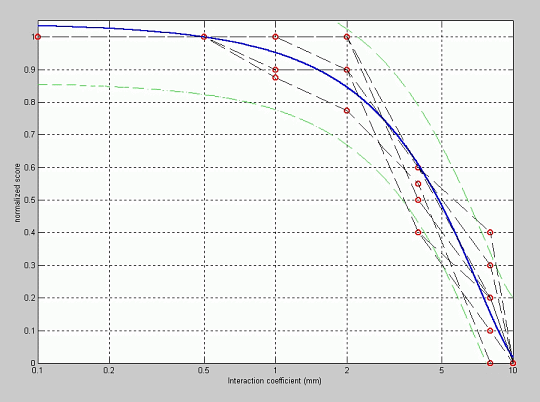
Figure 7: Fitting of the normalized quality score versus the channel interaction coefficient.
The authors acknowledge the collaboration provided by the ENT team of Hospital La Paz (Madrid, Spain), as well as that provided by the patients who participated in the validation tests.