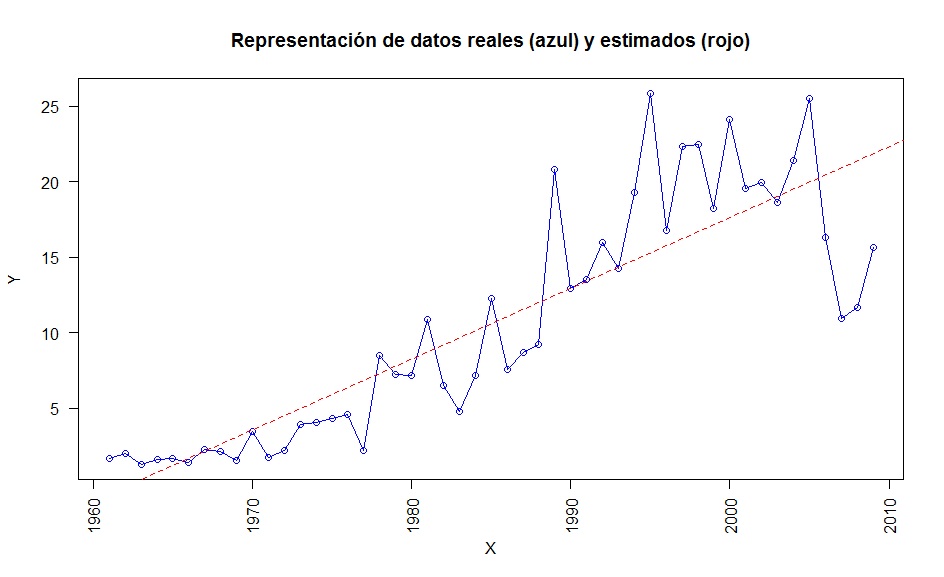
En este video se muestra como realizar una regresión por mínimos cuadrados. Más concretamente, se analiza el número de incendios anuales (medidos en miles) a partir del correspondiente año (datos). Obteniéndose:
$`Media
variable independiente`
[1] 1985
$`Varianza variable independiente`
[1] 204.1667
$`Media variable dependiente`
[1] 10.57743
$`Varianza variable dependiente`
[1] 60.39309
$Covarianza
[1] 95.82231
$Correlación
[1] 0.86294
$`Coeficiente Determinacion`
[1] 0.7446655
$`Término Independiente`
[1] -921.0501
$Pendiente
[1] 0.4693338
$`Valores reales, estimación y errores`
X Y
estimacion errores
[1,] 1961 1.680 -0.6865820 2.36658204
[2,] 1962 2.022 -0.2172483 2.23924827
[3,] 1963 1.302 0.2520855
1.04991449
[4,] 1964 1.645 0.7214193
0.92358071
[5,] 1965 1.686 1.1907531
0.49524694
[6,] 1966 1.443 1.6600868 -0.21708684
[7,] 1967 2.299 2.1294206
0.16957939
[8,] 1968 2.115 2.5987544 -0.48375439
[9,] 1969 1.558 3.0680882 -1.51008816
[10,] 1970 3.450 3.5374219 -0.08742194
[11,] 1971 1.718 4.0067557 -2.28875571
[12,] 1972 2.194 4.4760895 -2.28208949
[13,] 1973 3.932 4.9454233 -1.01342327
[14,] 1974 4.088 5.4147570 -1.32675704
[15,] 1975 4.340 5.8840908 -1.54409082
[16,] 1976 4.577 6.3534246 -1.77642459
[17,] 1977 2.221 6.8227584 -4.60175837
[18,] 1978 8.471 7.2920921 1.17890786
[19,] 1979 7.222 7.7614259 -0.53942592
[20,] 1980 7.190 8.2307597 -1.04075969
[21,] 1981 10.878 8.7000935 2.17790653
[22,] 1982 6.545 9.1694272 -2.62442724
[23,] 1983 4.791 9.6387610 -4.84776102
[24,] 1984 7.203 10.1080948 -2.90509480
[25,] 1985 12.238 10.5774286 1.66057143
[26,] 1986 7.570 11.0467623 -3.47676235
[27,] 1987 8.679 11.5160961 -2.83709612
[28,] 1988 9.247 11.9854299 -2.73842990
[29,] 1989 20.811 12.4547637 8.35623633
[30,] 1990 12.913 12.9240974 -0.01109745
[31,] 1991 13.531 13.3934312 0.13756878
[32,] 1992 15.955 13.8627650 2.09223500
[33,] 1993 14.254 14.3320988 -0.07809878
[34,] 1994 19.263 14.8014326 4.46156745
[35,] 1995 25.827 15.2707663 10.55623367
[36,] 1996 16.771 15.7401001 1.03089990
[37,] 1997 22.320 16.2094339 6.11056612
[38,] 1998 22.446 16.6787677 5.76723235
[39,] 1999 18.237 17.1481014 1.08889857
[40,] 2000 24.118 17.6174352 6.50056480
[41,] 2001 19.547 18.0867690 1.46023102
[42,] 2002 19.929 18.5561028 1.37289724
[43,] 2003 18.616 19.0254365 -0.40943653
[44,] 2004 21.396 19.4947703 1.90122969
[45,] 2005 25.492 19.9641041 5.52789592
[46,] 2006 16.334 20.4334379 -4.09943786
[47,] 2007 10.932 20.9027716 -9.97077163
[48,] 2008 11.656 21.3721054 -9.71610541
[49,] 2009 15.642 21.8414392 -6.19943918
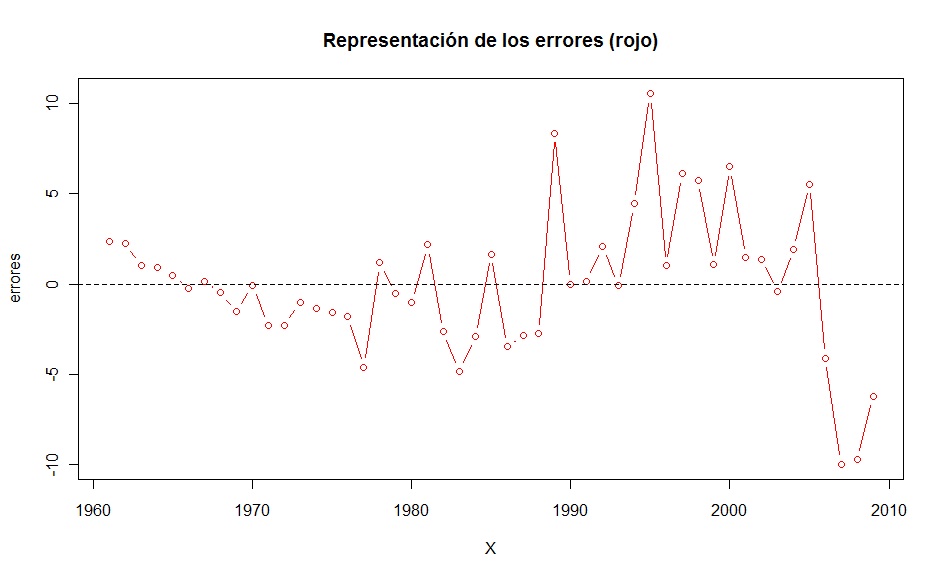
También se obtiene la representación de los errores y de la variable dependiente junto a su estimación: